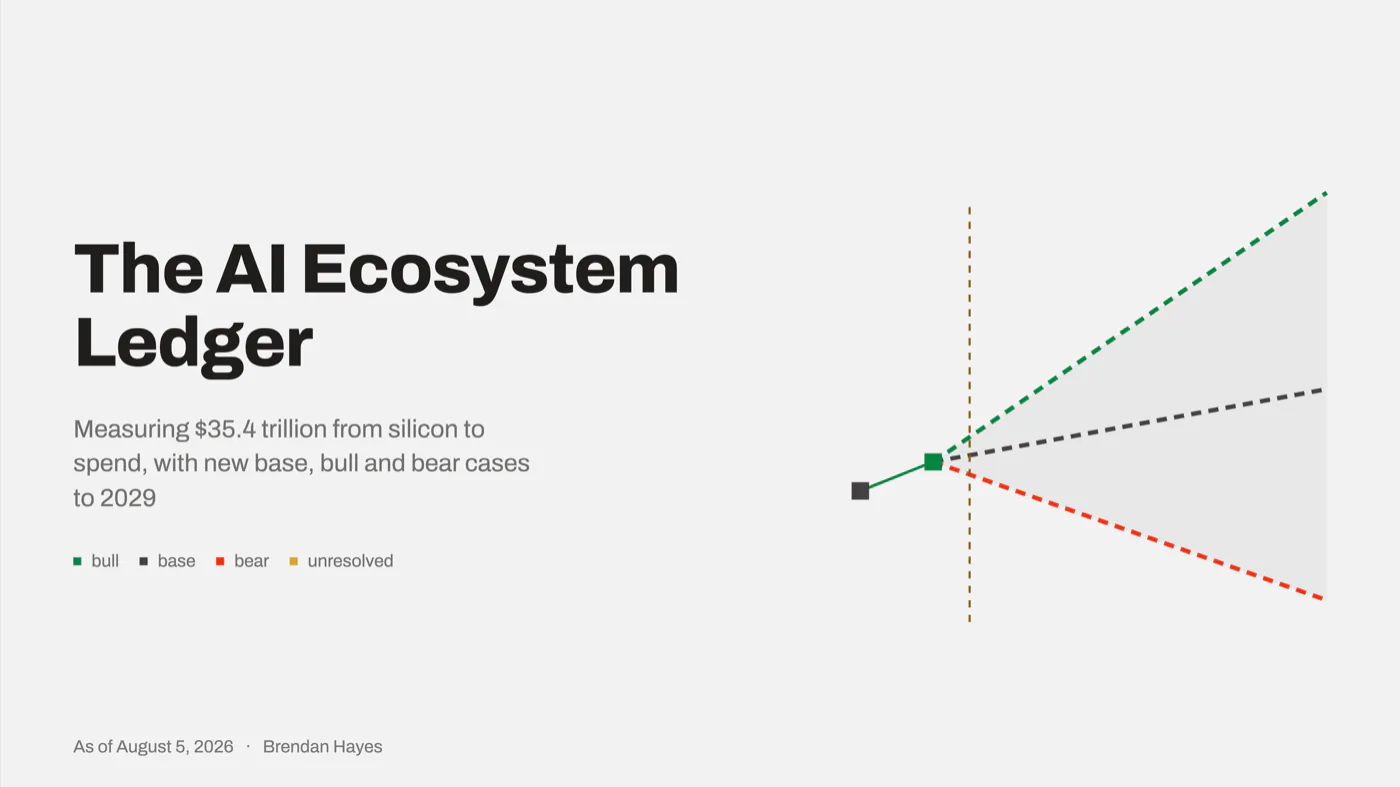
The AI Ecosystem Ledger tracks the combined value of the companies that build, fund, deploy and sell AI at Tier 1 scale, and projects it forward on a three-year horizon. The August 2026 edition measures $35.41 trillion across 24 entities, re-bases the 2029 cases to $24 trillion bear, $51 trillion base and $80 trillion bull, and closes the day before the SpaceX share lockup expires.
 Read the full deck →
The whole analysis is written out below. The deck is the same work with the charts.
Since May: running $2.8 trillion hot to the base case
In May this study set a 2029 base case of $34T inside a $20T to $51T range, from a $30.50T start. By August 5 the same 19-entity basis reads $33.56T: 9.0% above the base path in three months, and within 1.3% of the entire three-year target. The path there was violent, and two of four bear triggers fired.
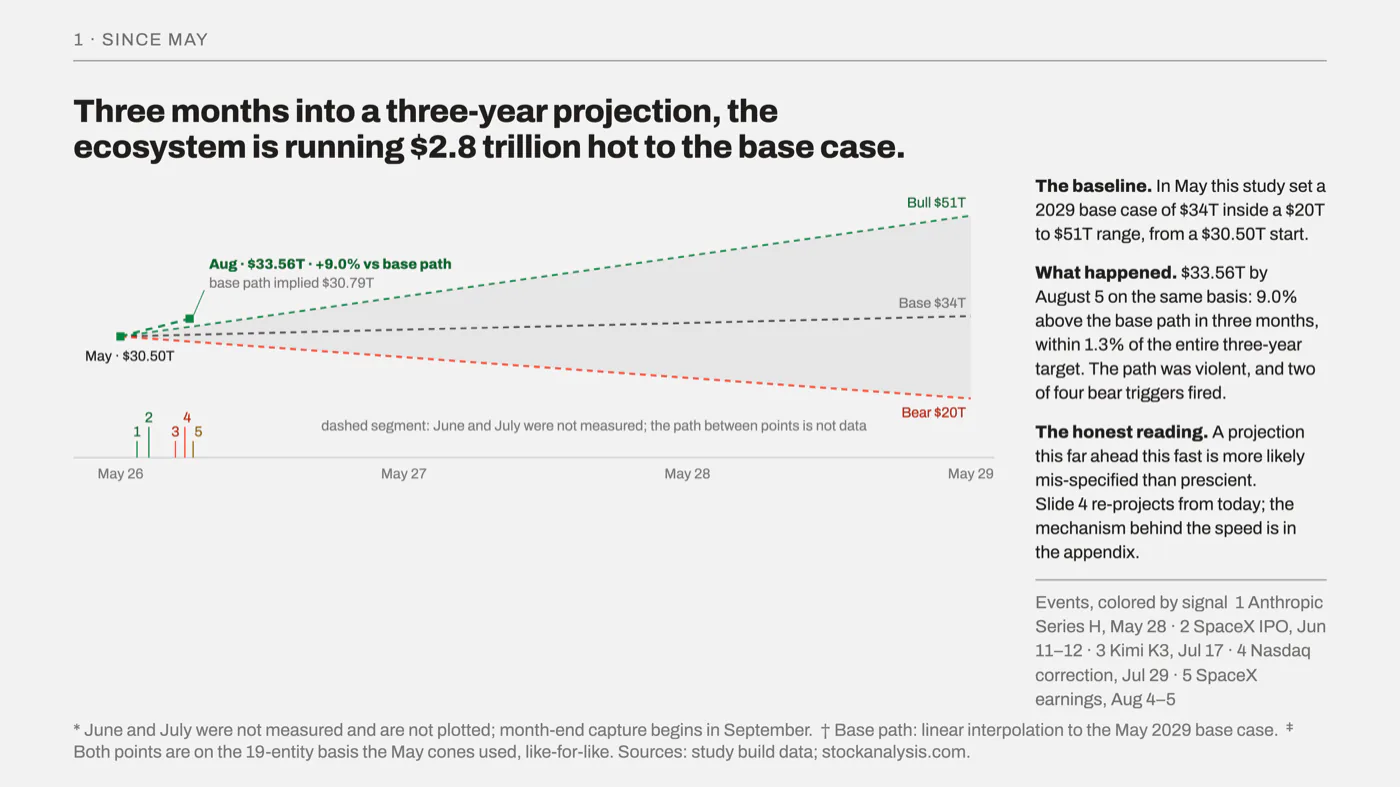
The honest reading is that a projection running this far ahead this fast is more likely mis-specified than prescient. So the cases were re-built from today rather than defended.
The 2029 cases, re-based from today
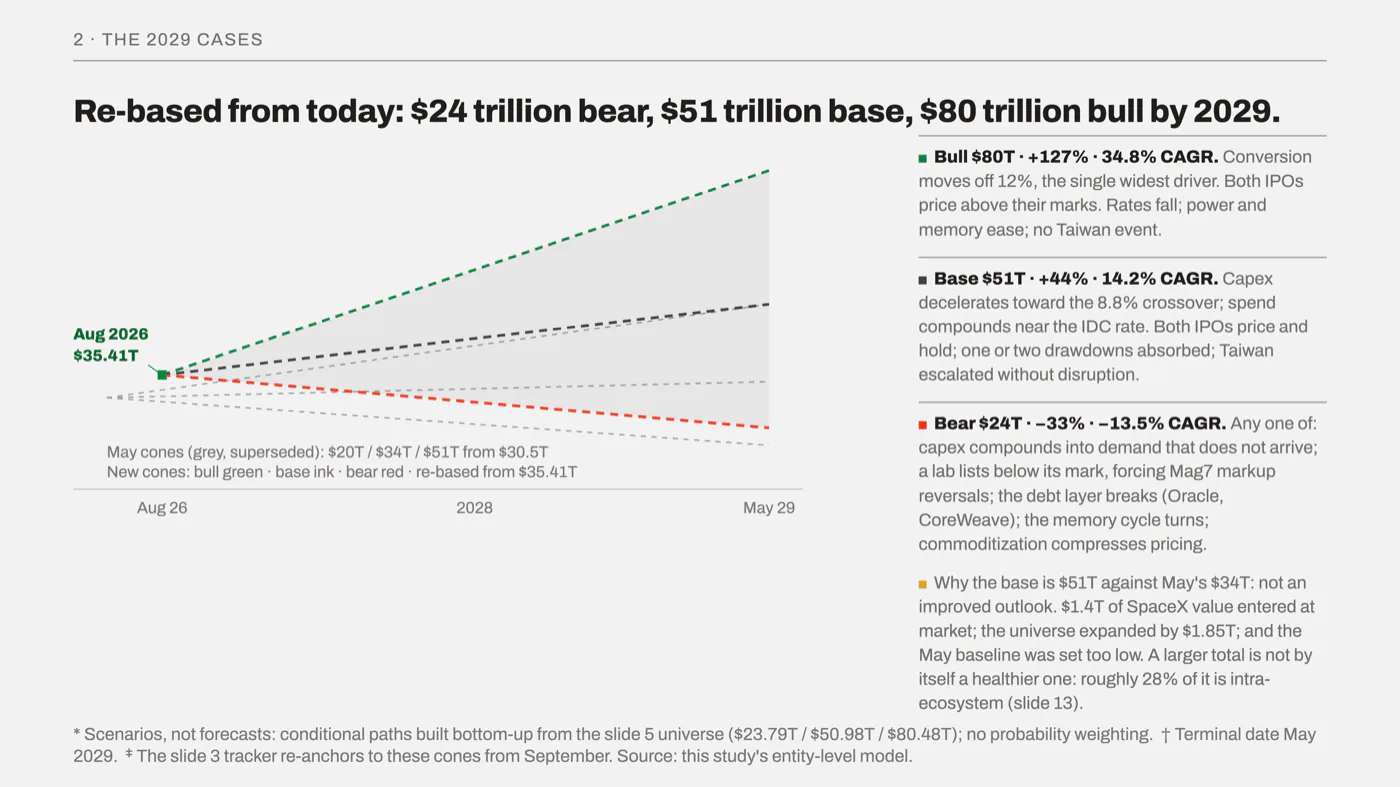
- Bull, $80T · +127% · 34.8% CAGR. Conversion moves off 12%, the single widest driver. Both IPOs price above their marks. Rates fall; power and memory ease; no Taiwan event.
- Base, $51T · +44% · 14.2% CAGR. Capex decelerates toward the 8.8% crossover; spend compounds near the IDC rate. Both IPOs price and hold; one or two drawdowns absorbed; Taiwan escalated without disruption.
- Bear, $24T · −33% · −13.5% CAGR. Any one of: capex compounds into demand that does not arrive; a lab lists below its mark, forcing Magnificent 7 markup reversals; the debt layer breaks (Oracle, CoreWeave); the memory cycle turns; commoditization compresses pricing.
The base moving from May's $34T to $51T is not an improved outlook. $1.4T of SpaceX value entered at market, the universe expanded by $1.85T, and the May baseline was set too low. A larger total is not by itself a healthier one: roughly 28% of it is intra-ecosystem.
These are scenarios, not forecasts — conditional paths built bottom-up from the entity table below ($23.79T / $50.98T / $80.48T), with no probability weighting. Terminal date May 2029.
The measurement: 24 entities, four groups, one total
Everything else in this study reconciles to this table.
| Entity | Ticker / status | Value | Basis |
|---|---|---|---|
| Magnificent 7 | $23.63T | ||
| Nvidia | NVDA | $5.38T | Price |
| Apple | AAPL | $4.51T | Price |
| Alphabet | GOOGL | $4.42T | Price |
| Microsoft | MSFT | $3.64T | Price |
| Amazon | AMZN | $2.93T | Price |
| Meta | META | $1.48T | Price |
| Tesla | TSLA | $1.27T | Price |
| Frontier labs + SpaceX | $3.25T | ||
| SpaceX / xAI | SPCX · public Jun 12 2026 | $1.43T | Price |
| Anthropic | Private · S-1 filed | $965B | Mark |
| OpenAI | Private · S-1 filed | $852B | Mark |
| Semiconductor + infrastructure | $8.43T | ||
| Broadcom | AVGO | $2.01T | Price |
| TSMC | TSM | $1.93T | Price |
| Micron | MU | $1.04T | Price |
| AMD | AMD | $795.60B | Price |
| ASML | ASML | $651.34B | Price |
| Applied Materials | AMAT | $429.99B | Price |
| Oracle | ORCL | $415.91B | Price |
| Lam Research | LRCX | $391.17B | Price |
| Arm | ARM | $296.54B | Price |
| KLA | KLAC | $253.10B | Price |
| Cadence | CDNS | $92.71B | Price |
| Synopsys | SNPS | $77.08B | Price |
| CoreWeave | CRWV | $50.06B | Price |
| Consulting | $104B | ||
| Accenture | ACN | $104.01B | Price |
| Aggregate ecosystem value | 24 entities | $35.41T | |
Intraday quotes 5 August 2026, 3:01–3:03 PM EDT (stockanalysis.com). Total company value, not an AI-attributable share. Anthropic and OpenAI carry negotiated, stale marks rather than continuous prices; both have filed S-1s. Inclusion criteria: materiality ($50B+), AI-thesis dependence, US-anchored with named exceptions (TSMC, ASML, Arm).
The universe expanded from 19 to 24 entities on August 5 — Micron, Lam Research, KLA, Cadence and Synopsys, all semiconductors. Both bases printed at the join and history was never restated. On the seven-year view the ecosystem has run from $6.0T in 2019 to $35.41T today, and the last three months moved about as much as a typical year.
Five layers, and every dollar sits in exactly one
- Layer 1 · Semiconductors and equipment · $13.35T · 37.7%. Designers, foundry, lithography, semicap, IP. The physical constraint.
- Layer 2 · Platforms and compute · $18.72T · 52.8%. Hyperscale capital, distribution and compute capacity, including the two independent compute providers.
- Layer 3 · Frontier labs · $3.25T · 9.2%. The model builders, now including one that is publicly traded.
- Layer 4 · Consulting and GTM · $0.10T · 0.3%. The channel that converts lab capability into Fortune 500 revenue.
- Layer 5 · End demand · $0 measured value. Where the money comes from, not where it is held. Demand is a flow.
Layers are assigned by primary economic function, not index membership: Nvidia sits in Layer 1 rather than with the Magnificent 7, and Oracle and CoreWeave are compute providers in Layer 2.
Inside Layer 1, a $0.17T tier gates an $8.48T one
Designers and IP are $8.48T (NVDA, AVGO, AMD, ARM). Under them: memory at $1.04T (MU), the tightest live bottleneck on effective compute per accelerator; foundry at $1.93T (TSM), about 90% of the world's most advanced chips; lithography and semicap at $1.73T (ASML, AMAT, LRCX, KLAC), every leading-edge wafer on earth; and EDA at $0.17T (CDNS, SNPS), which decides whether a leading-edge design is possible at all.
Four chokepoints govern the tier: EUV lithography, one supplier (ASML); advanced foundry, one dominant (TSMC, ~90%); HBM memory, three suppliers worldwide, one American, in shortage into 2028; EDA, two firms. $3.06T of the global chain — Samsung, SK Hynix, CXMT, Intel — sits outside this universe and is never added.
Demand has to overtake the buildout, and only one deceleration does it
Two lines have to cross. Enterprise AI spend is what end customers actually pay. Hyperscaler capex is what the ecosystem is laying down ahead of them, and it is compounding faster.
2026 enterprise AI spend is $407B, up 34.8% from $302B. 2026 hyperscaler capex is $725B, up 77% from $410B. Supply runs ahead of demand 1.8 to 1 today. That becomes fatal only if capex keeps compounding faster than the demand it is built for.
At IDC's 31.9% rate, enterprise spend reaches about $934B in 2029. For capex to stay below that, it has to grow under 8.8% a year, down from 77%. Every scenario above is a view on that deceleration.
| Segment | 2025 | 2026 | Share | 2029 at IDC rate | Growth 2026–29 |
|---|---|---|---|---|---|
| F500 enterprise | $201B | $271B | 66.7% | $622B | +$351B |
| Mid-market and SMB | $43B | $58B | 14.3% | $133B | +$75B |
| Sovereign and government | $25B | $34B | 8.3% | $78B | +$44B |
| Global startups | $33B | $44B | 10.7% | $101B | +$57B |
| Total enterprise AI spend | $302B | $407B | 100% | $934B | +$527B |
Totals are sourced (Gartner 2025 and 2026; IDC's 31.9% rate to 2029). The segment split is this study's allocation held at constant 2026 mix — modelled, not reported, and labelled as such. Expect mix shift toward sovereign and regulated F500. Spend and capex are annual flows and are never summed with the $35.41T aggregate, which is a stock: that is the most common misreading of this comparison.
Stickiness varies sharply by segment. Sovereign and defense is the stickiest — DoD awards to Anthropic, OpenAI, Google and xAI, Anthropic's classified Palantir work, Gulf multi-year compute. Regulated F500 is close behind, where switching costs and compliance burden make consulting deployments hard to displace. General F500 is the exposed tier: most pilots, most negotiable, most vulnerable to commoditization, with Kimi K3 a live pricing threat. Mid-market and SMB stays underserved and price-sensitive, which is the gap OpenAI's Deployment Company and Anthropic's partner network are both aimed at.
The binding constraint is pilot economics, not model capability
88% of organizations use AI in at least one function. About 12% of pilots reach production (IDC and MIT, deployment denominator). About 5% deliver measurable P&L return (MIT Project NANDA, financial denominator). The 12% and the 5% measure different things and are not two points on one funnel, but they point the same way.
The new information is abandonment: 17% of companies abandoned most of their AI initiatives in 2024, and 42% in 2025 (S&P Global Voice of the Enterprise). Alongside it, 73% of failed projects had no pre-agreed success definition and 61% of ROI-approved projects were never measured (MIT Sloan, 2025).
What that implies: pilot economics, not model capability and not compute supply, is the binding constraint on demand acceleration. Every point of conversion improvement is worth more to the 2029 total than another gigawatt. It is the widest single driver of the range between the cases.
About 28% of the value never left the ecosystem
Roughly $9T to $11T of the $35.41T traces to capital that circulated inside the ecosystem. This quarter the accounting became visible in the S&P 500's headline earnings.
- ~$680B — equity stakes in labs, marked to market. Amazon $190.4B carrying; Alphabet ~$135B; Microsoft ~$230B implied; Nvidia $30B; ~$86B SpaceX.
- ~$1.8T — lab value sustained by intra-ecosystem primary capital. OpenAI $852B plus Anthropic $965B, with the majority of primary capital sourced inside the ecosystem.
- ~$1.5T NPV — contracted compute revenue cycling back to its funders. OpenAI $1.15T of commitments; Anthropic $130B+; SpaceX ~$26B annualized from Anthropic and Google.
- ~$3T–$5T — public value attributable to markup earnings. Q2 markup earnings of ~$155.6B across Alphabet, Amazon and Microsoft, capitalized at prevailing multiples.
The mechanisms, named precisely: vendor financing (Nvidia's $30B in OpenAI paired with hardware commitments), round-tripping (Alphabet and Amazon invest in Anthropic, which contracts their compute), and reflexivity (marks raise earnings, which fund the next mark). The loop closed in Q2 2026.
The third-party validation is in the index. Blended S&P 500 Q2 2026 earnings growth was 47.4%, the highest since Q2 2021 (FactSet). Excluding Alphabet and Amazon it was 28.8%. The 18.6-point gap is substantially paper gains on AI marks, all traceable to the May 28 Series H print. Alphabet's Q2 AI gains were 69% of net income; Amazon's about 66% pre-tax; Microsoft's worth $0.33 of EPS.
An estimate built from disclosed structures, not a reported figure, and the range is wide on purpose. Disclosed structures are not allegations of impropriety. Alphabet's 10-Q does not name Anthropic; that attribution is press-derived.
The SpaceX unlock
SpaceX priced at $135 on June 11 raising $75B, the largest IPO ever. It closed day one at $161 (~$2.12T) and peaked at $225.64 (~$2.97T). After its first public earnings it fell 13.4% to $108.51 — $1.43T, 19.6% below its offer price and 51.9% below its peak. Q2 capex was $18.4B, $15.83B of it AI, against a $541M net loss and $3.5B adjusted EBITDA.
Supporting the price: $920M/month from Google for 32 months (~$29.4B) and $1.25B/month from Anthropic through May 2029 (~$45B), about $26B annualized combined, plus Nvidia GPU exclusivity, which moved Nvidia up 4.8%. Against it: that capex, that net loss, and a float that could more than quadruple on August 6 when the lockup expires.
All three labs are now public or filed to be
| SpaceX / xAI | Anthropic | OpenAI | |
|---|---|---|---|
| Status | Public, Jun 12 2026 | S-1 filed Jun 1 | S-1 filed Jun 8 |
| Value | $1.43T price | $965B mark | $852B mark |
| Change vs. May | +14% (was $1.25T private) | +154% (was $380B) | Flat · secondaries near $810B |
| Revenue | $7.8B quarterly, +92% | $47B run rate, company-stated | $24B–$33B run rate |
| Profitability | −$541M net · +$3.5B adj. EBITDA | >$1B GAAP operating profit projected | Loss-making |
| Next catalyst | Lockup expiry Aug 6 | Oct 2026 Nasdaq listing target | Timing undisclosed |
Anthropic's Series H closed May 28 at $965B post-money, raising $65B — the largest venture round ever. OpenAI's last primary mark was $852B (March 2026, $122B raised); secondaries trade near $810B, the first negative private mark in this dataset. Revenue bases are inconsistent: Anthropic is $47B company-stated against >$60B SemiAnalysis, $69B Yipit and $69.6B–$74.1B TickerTrends, a 47% spread, and Anthropic books gross where OpenAI is closer to net.
What August 6 actually tests
SpaceX is 4.0% of the measured ecosystem and 44% of the labs group. It is also the template for October, when Anthropic's $965B mark meets a public float — with three Magnificent 7 balance sheets carrying Q2 gains booked against that mark. Three outcomes, each mapping to a case:
- If the price holds or recovers. A full float validates the $1.43T public price and the ~$26B of annualized contracted compute revenue behind it. Supports the base and bull labs trajectory and firms the ground under Anthropic's October listing.
- If it drifts on volume. Orderly absorption of a quadrupled float is itself information: the market can clear trillion-dollar AI paper.
- If it sells off hard. Forced supply against a loss-making balance sheet cuts the labs group directly and pressures the October listing. A lab pricing below its mark is the bear case's reversal event — markup reversals across Alphabet, Amazon and Microsoft, with the S&P 500 earnings effect running in reverse.
Either way, the September edition captures the month-end close, extends the tracker, and re-tests the cones against the first full-float print. If the labs group re-rates by more than the bear-to-base gap implies, the cones get re-based again rather than stretched.
Method and sources
This study measures total company value, not an AI-attributable share; no attribution model is applied anywhere. Entities qualify on materiality ($50B+), AI-thesis dependence and US anchoring, with named exceptions for TSMC, ASML and Arm. Marks are negotiated and stale; prices are continuous; the two are never blended without saying so. Stocks and flows are kept apart — the $35.41T aggregate is a stock, and spend and capex are annual flows.
Sources for this edition: stockanalysis.com; company filings and ir.spacex.com; Gartner (January and May 2026); IDC AI and Generative AI Spending Guide; FactSet; MIT Project NANDA "GenAI Divide" (2025); MIT Sloan (2025); S&P Global Voice of the Enterprise (2025); CNBC; Axios; Tom's Hardware.
The Ledger is published monthly. The next edition lands 5 September 2026.